One-click weekly sales report in Google Sheets
Click Reports > Run weekly report. The raw Orders sheet is cleaned, every bad row is listed with its reason, all amounts are converted to USD at live rates, and a summary with a chart lands in the sheet and in your inbox. A Monday trigger can run it for you.
Status: Numbers from a real run of the same Apps Script files in a Node harness against the live exchange-rate API; the install guide for your own Google Sheet is included. The harness uses stand-ins for the Google services; the data is 500 synthetic orders.
What you get with one click
Every valid order with its date, week, USD amount and the rate used. Your Orders tab is never changed.
Each row left out, with the reason and the original values, so it can be fixed and re-run. 34 in the test run.
Totals by week, region and product, the top 5 products and the change vs the previous week.
The summary as an HTML email with inline styles, plus a run log and an error email if a run fails.
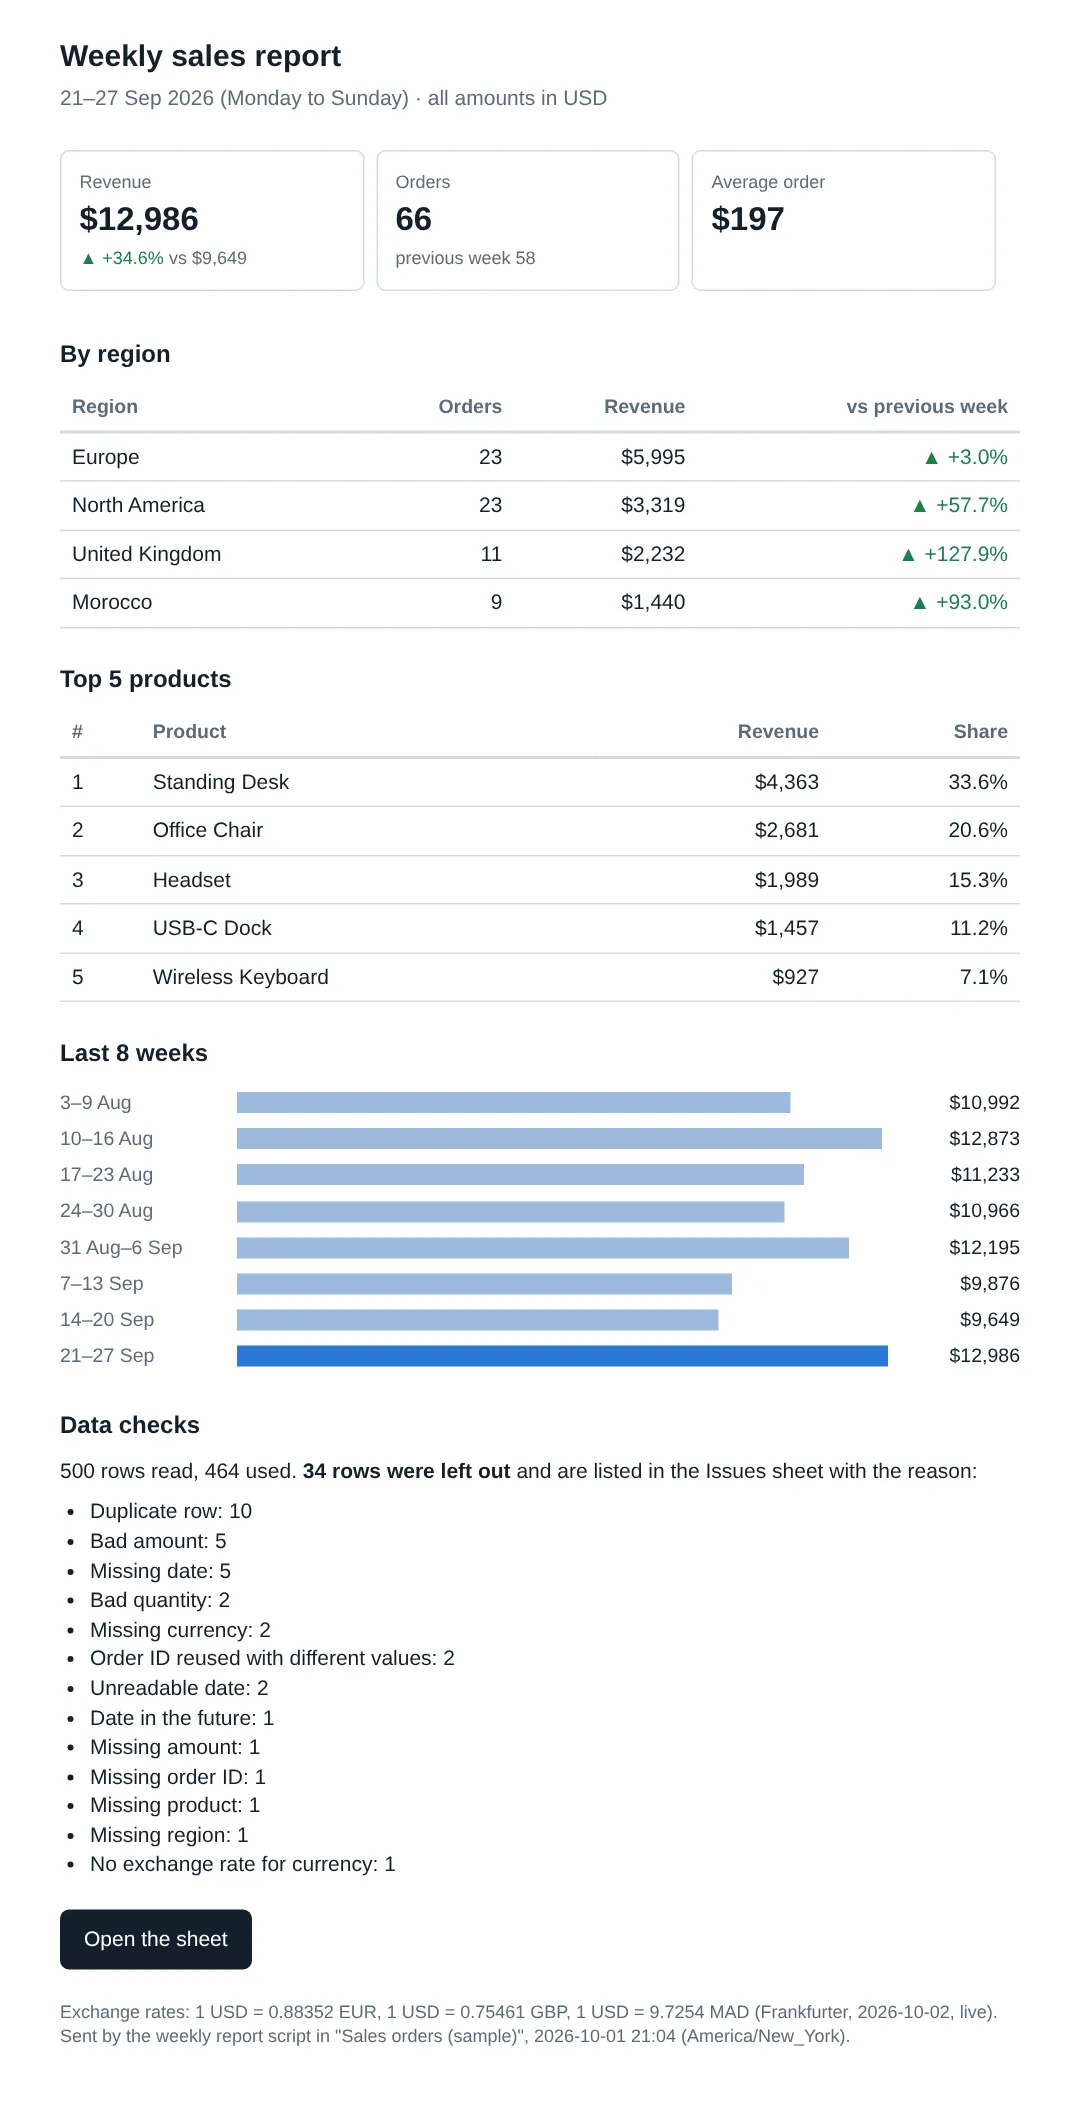
The real summary from the test run: 21–27 Sep 2026
By region
| Region | Orders | Revenue | Previous week | Change |
|---|---|---|---|---|
| Europe | 23 | $5,995 | $5,819 | +3.0% |
| North America | 23 | $3,319 | $2,105 | +57.7% |
| United Kingdom | 11 | $2,232 | $979 | +127.9% |
| Morocco | 9 | $1,440 | $746 | +93.0% |
Top 5 products
| # | Product | Orders | Revenue | Share |
|---|---|---|---|---|
| 1 | Standing Desk | 8 | $4,363 | 33.6% |
| 2 | Office Chair | 10 | $2,681 | 20.6% |
| 3 | Headset | 9 | $1,989 | 15.3% |
| 4 | USB-C Dock | 10 | $1,457 | 11.2% |
| 5 | Wireless Keyboard | 9 | $927 | 7.1% |
Revenue by week (the chart's data)
| Week (Mon to Sun) | Orders | Revenue | Change |
|---|---|---|---|
| 3–9 Aug | 55 | $10,992 | |
| 10–16 Aug | 55 | $12,873 | +17.1% |
| 17–23 Aug | 52 | $11,233 | -12.7% |
| 24–30 Aug | 58 | $10,966 | -2.4% |
| 31 Aug–6 Sep | 58 | $12,195 | +11.2% |
| 7–13 Sep | 62 | $9,876 | -19.0% |
| 14–20 Sep | 58 | $9,649 | -2.3% |
| 21–27 Sep | 66 | $12,986 | +34.6% |
The real email from the test run
Cleaning rules
- Spaces and case: " europe " and "EUROPE" become "Europe" (the most used spelling wins).
- Duplicates: exact copies are removed (10 in the test). An order ID reused with other values is flagged and the first one kept (2).
- Dates: text like 2026-09-21 and 21/09/2026 (or 09/21/2026, set in Settings) is read. Cells Sheets already turned into dates are used as they are. Blank, unreadable or future dates are flagged.
- Amounts: 1,250.00 and 1.250,50 and $1,250.00 are read correctly. Text, zero or negative amounts are flagged.
- Currencies: €, £, $, Dh and lowercase codes are recognized. Blank or unknown codes are flagged.
- Missing fields: no order ID, region or product, or a bad quantity: flagged.
Exchange rates
Live from the free Frankfurter API, cached for 6 hours. In the test run: 1 USD = 0.88352 EUR, 1 USD = 0.75461 GBP, 1 USD = 9.7254 MAD (2026-10-02). If the API is down, the last good rates (up to 7 days old) are used and the email says so. With no usable rates the run stops before changing any sheet and emails the error; a simulated outage test checks exactly that.
Install it in your Google Sheet
- Put your orders in a tab named Orders: Order ID, Order Date, Customer, Region, Product, Qty, Amount, Currency. Importing a CSV? Untick "Convert text to numbers, dates, and formulas", so Sheets cannot swap day and month.
- Extensions > Apps Script: paste the 8 script files and the manifest, then save.
- Reports > Run weekly report and allow the permissions. It asks for 5 narrow ones: this spreadsheet only, the menu, the rate API, sending email, and the trigger.
- Type your email in the Settings tab the first run creates.
- Reports > Install weekly trigger: every Monday between 7 and 8 am, in the sheet's time zone.
Synthetic data: 500 rows of orders from 3 Aug 2026 to 27 Sep 2026 in USD, EUR, GBP and MAD, with 34 deliberately bad rows and 2 blank lines, loaded as text as the install steps say. Google Apps Script (V8), tested in Node with stand-ins for SpreadsheetApp, MailApp, UrlFetchApp, CacheService and the other services; the exchange-rate requests were real.